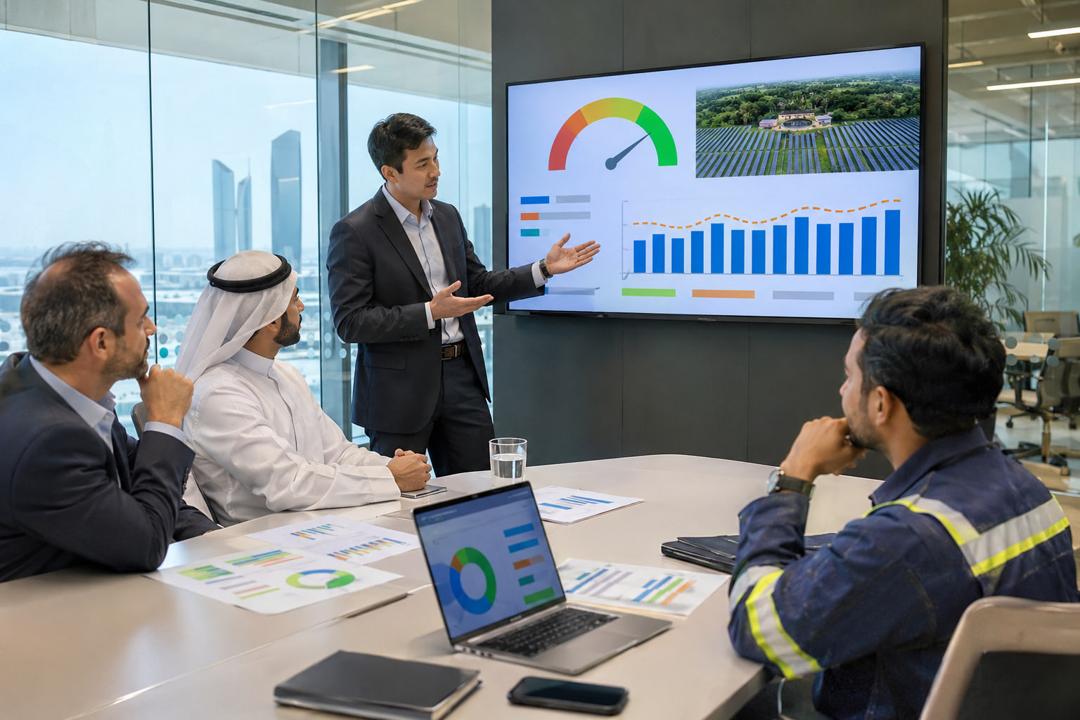
Energy produced on its own says little — a weak month may simply have been hazy or dusty. Performance analytics normalise output against measured irradiance and temperature to produce indicators that can be compared across months and sites: performance ratio (PR) and temperature-corrected PR, technical and contractual availability, specific yield and inverter efficiency, calculated following IEC 61724-1.
In the region, soiling is often the largest controllable loss. Using soiling sensors, or a reference string cleaned on a fixed schedule, the software estimates the soiling loss and helps decide when another cleaning round pays for itself. Monthly reports then show expected versus actual energy, a loss breakdown and an event log — the format O&M contracts and lenders usually ask for.
KPIs are only as reliable as the sensors behind them: pyranometers must be clean, level and calibrated, and data gaps must be handled transparently. We review the sensor set-up, configure the calculations and deliver monthly reports. The indicative price is per site per year.

Multi-brand web portal and phone app for live production, alarms and automated reports across one site or a whole portfolio.

Work orders, ticketing, preventive maintenance plans and spare-parts stock for teams looking after many PV sites.
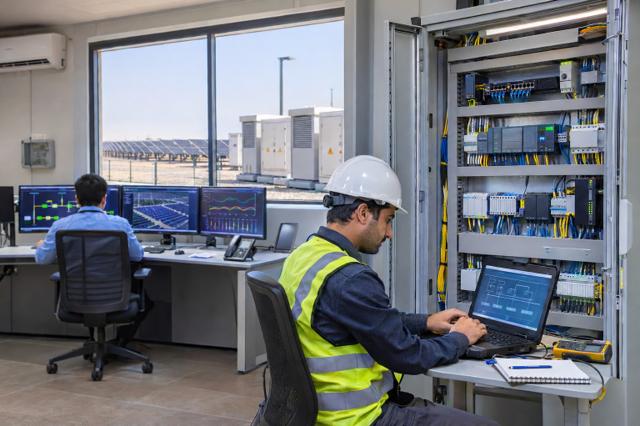
Engineering service to configure plant SCADA and the power plant controller, map every signal and prove grid-code performance at commissioning.

Hourly energy simulation with meteo data and detailed loss modelling, producing P50/P90 yields and reports that lenders accept.
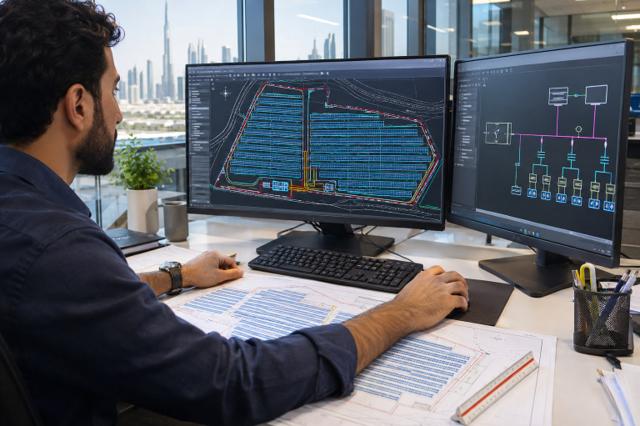
Array layout, row spacing, string plans, single-line diagrams and cable routing, from first sketch to construction drawings.
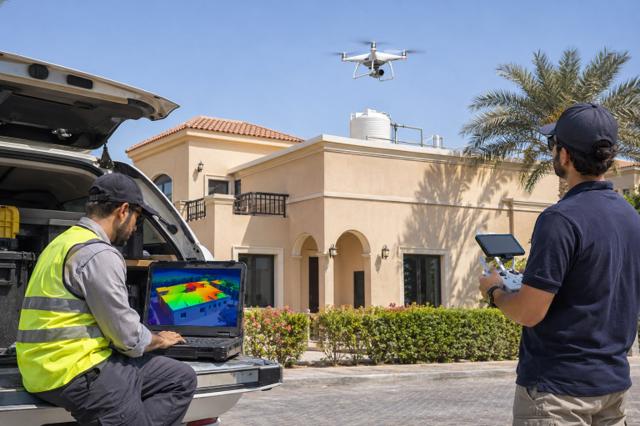
Accurate 3D model of a roof or site from a drone survey, used to quantify shading losses before the design is fixed.
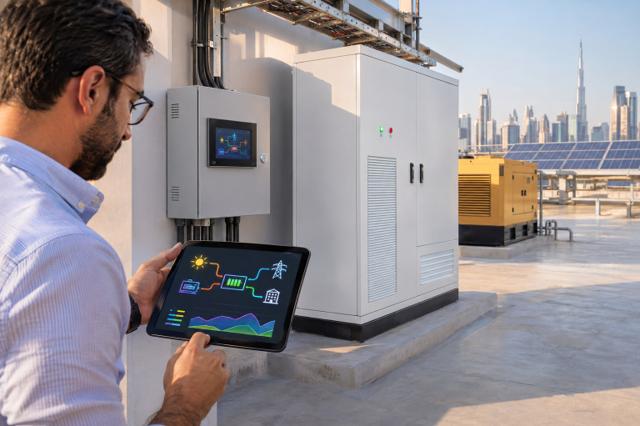
Controller and software that coordinate PV, batteries, generator and grid to cut energy cost, respect export limits and keep critical loads running.
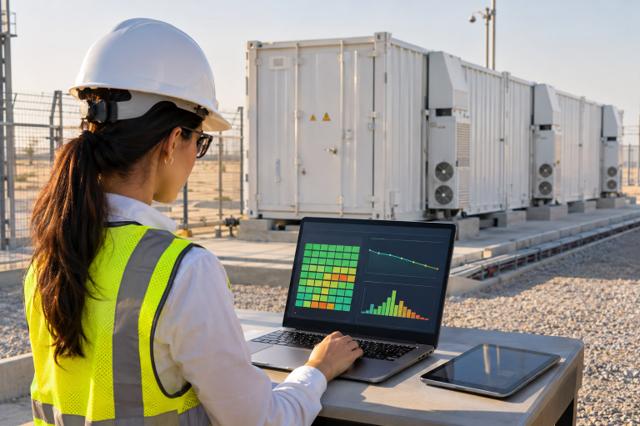
Cloud analysis of BMS data to track state of health, cell imbalance and degradation, and to build evidence for warranty claims.
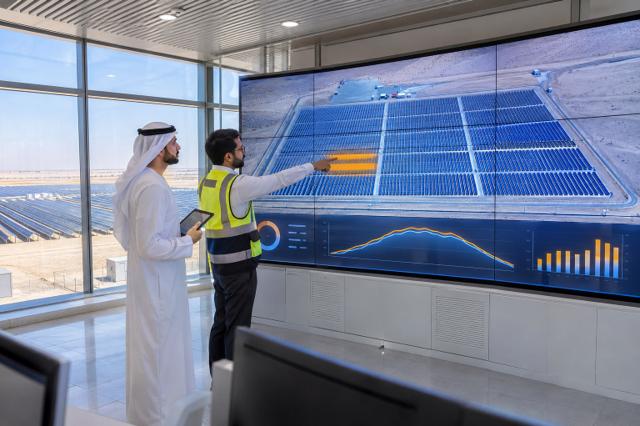
Physics-based model of the actual plant that runs alongside it, comparing expected and measured output to locate faults and losses.

Connecting plant data to ERP, BI dashboards, billing systems or the utility over Modbus, IEC 104, MQTT and REST.
