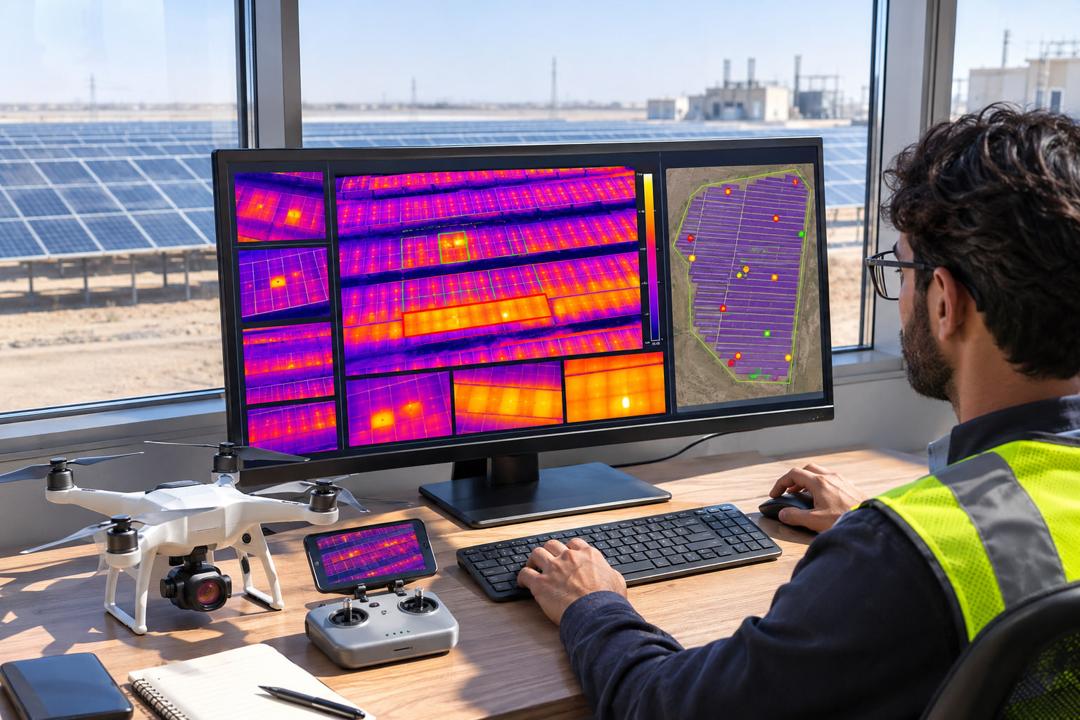
A drone with a radiometric thermal camera can inspect a megawatt of modules in minutes, but a large plant produces tens of thousands of images. AI analysis software stitches them into an orthomosaic, detects temperature anomalies and classifies them — single-cell hot spots, multi-cell patterns, bypass-diode failures, open strings, disconnected modules, broken glass or heavy soiling — and places each one on a map with its row, table and module position.
Results are only as good as the flight. Irradiance should be above roughly 600 W/m² and stable, with suitable camera angle and ground resolution, as described in IEC TS 62446-3. Each anomaly should be reported with its temperature difference and a severity class so the O&M team can prioritise, and repeat findings should be tracked from one inspection to the next.
We arrange the flight or process imagery you already have, and deliver a report with a fault list, estimated energy loss and recommended actions. The indicative price is per kWp inspected for plants above about 1 MWp; smaller sites have a minimum charge.

Multi-brand web portal and phone app for live production, alarms and automated reports across one site or a whole portfolio.

Work orders, ticketing, preventive maintenance plans and spare-parts stock for teams looking after many PV sites.
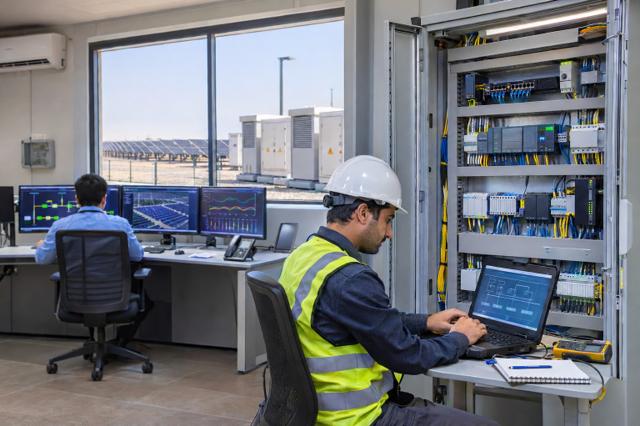
Engineering service to configure plant SCADA and the power plant controller, map every signal and prove grid-code performance at commissioning.

Hourly energy simulation with meteo data and detailed loss modelling, producing P50/P90 yields and reports that lenders accept.
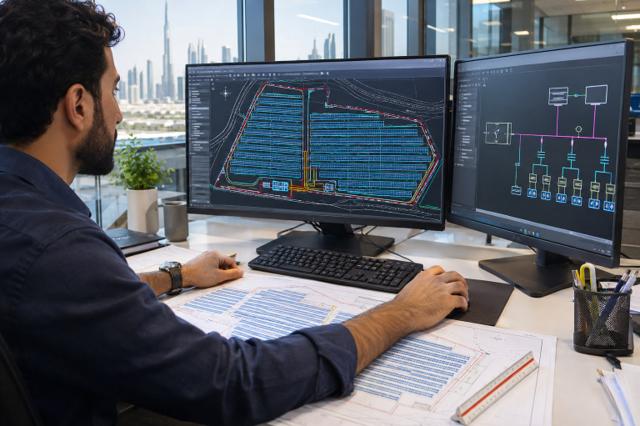
Array layout, row spacing, string plans, single-line diagrams and cable routing, from first sketch to construction drawings.
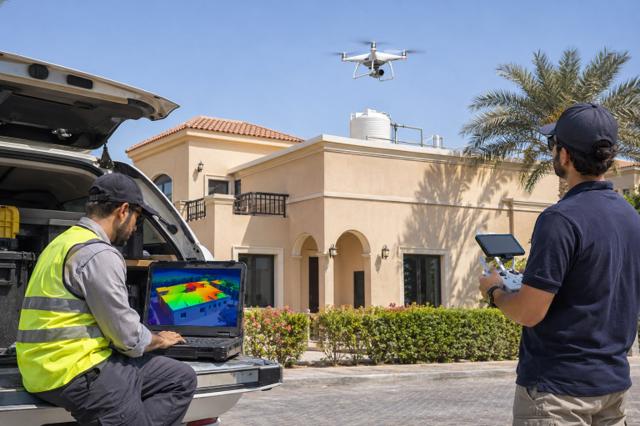
Accurate 3D model of a roof or site from a drone survey, used to quantify shading losses before the design is fixed.
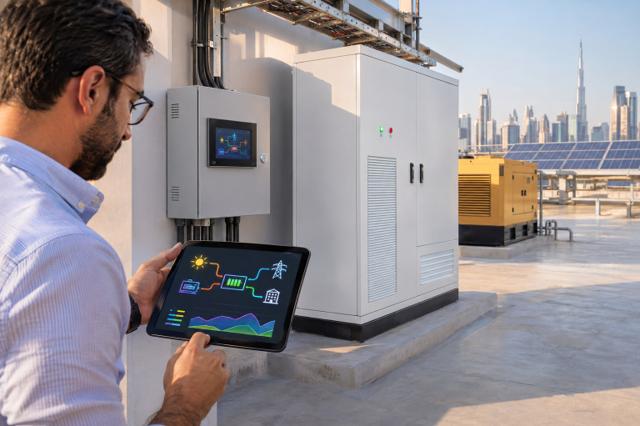
Controller and software that coordinate PV, batteries, generator and grid to cut energy cost, respect export limits and keep critical loads running.
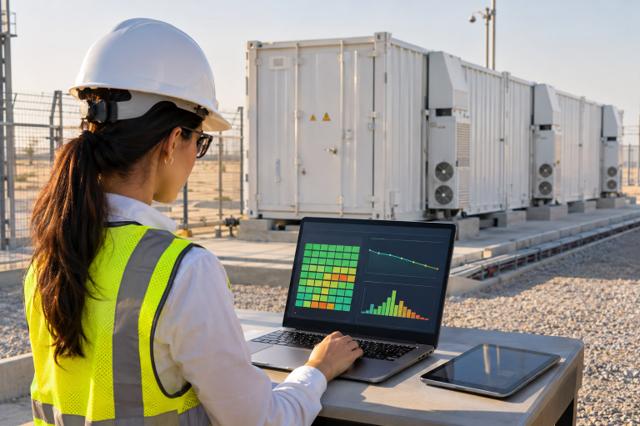
Cloud analysis of BMS data to track state of health, cell imbalance and degradation, and to build evidence for warranty claims.
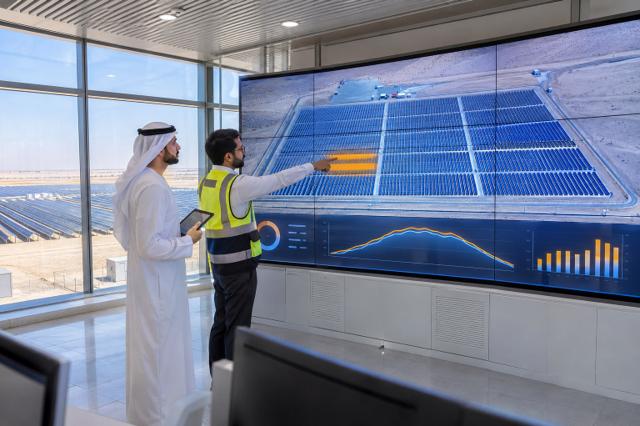
Physics-based model of the actual plant that runs alongside it, comparing expected and measured output to locate faults and losses.

Connecting plant data to ERP, BI dashboards, billing systems or the utility over Modbus, IEC 104, MQTT and REST.
