Performance ratio, temperature-corrected PR, availability, specific yield, soiling ratio and MTTR — what each KPI tells you, how it is calculated and how to turn alarms into action.

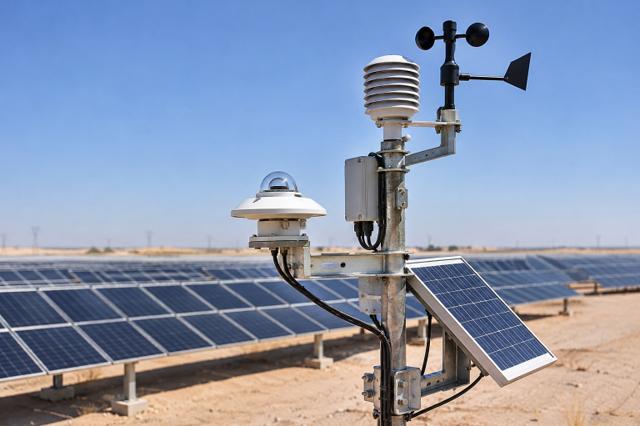
A PV plant earns money only when it produces, so operation and maintenance are managed by numbers. A good monitoring system — inverter data, string or combiner currents, energy meters and an on-site weather station with a plane-of-array irradiance sensor — turns raw data into a handful of key performance indicators (KPIs) that are usually written into O&M contracts and lender reports.
Specific yield is the simplest: energy delivered (kWh) divided by installed DC power (kWp) over a period, for example 1,750–2,100 kWh/kWp per year for a well-designed fixed-tilt plant in the UAE. It allows plants of different sizes to be compared, but it depends heavily on weather, so on its own it cannot separate a sunny year from a well-run plant.
Performance ratio (PR) removes the weather: PR = actual yield ÷ reference yield, where reference yield is in-plane irradiation (kWh/m²) divided by 1 kW/m². A PR of 0.80 means the plant delivered 80 % of what its nameplate would produce under that irradiation at STC. Typical annual values are 0.78–0.85. Because PR falls in hot weather, contracts often use a temperature-corrected PR (following IEC 61724-1 approaches), which adjusts for the difference between actual and reference cell temperature so that summer and winter results can be compared fairly and a guarantee is not missed merely because of a heatwave.
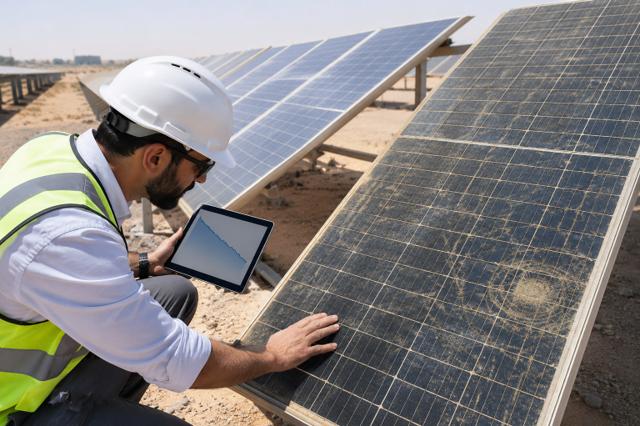
Availability measures how much of the time — or, better, of the potential energy — the plant was able to produce. Time-based availability counts hours with irradiance above a threshold when equipment was running; energy-based availability weights outages by the energy that would have been produced. Contracts define exclusions such as grid curtailment, force majeure and scheduled maintenance at night. Targets of 98.5–99.5 % are common. The soiling ratio compares the output of a dirty reference cell or string with a clean one; in desert climates it drives the cleaning schedule, and daily losses of 0.2–1 % without cleaning are not unusual.
Maintenance responsiveness is measured with MTTR (mean time to repair), MTBF (mean time between failures) and response times per alarm category. Alarm management makes these KPIs achievable: set meaningful thresholds (string current deviation, inverter derating, communication loss), group duplicate alarms, assign priorities by energy at risk, and log every ticket from detection to closure. A monthly report that tracks PR, availability, soiling loss, open tickets and lost energy — with causes — gives owners a clear picture and lets O&M teams focus on the faults that cost the most.

From photon to kilowatt-hour: the physics of a solar cell and the path of energy through a complete PV system.
GHI, DNI and DHI explained, how sun position changes through the day and year, and why the Gulf is one of the world's best solar resources.
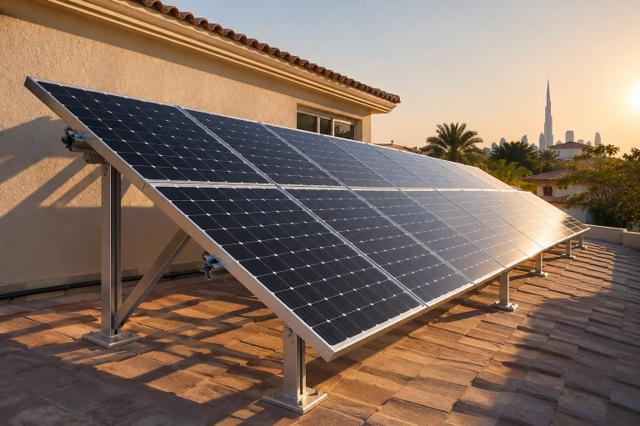
How to orient a PV array: the latitude rule of thumb, why lower tilts often win in the Gulf, and how east–west layouts trade yield for density.
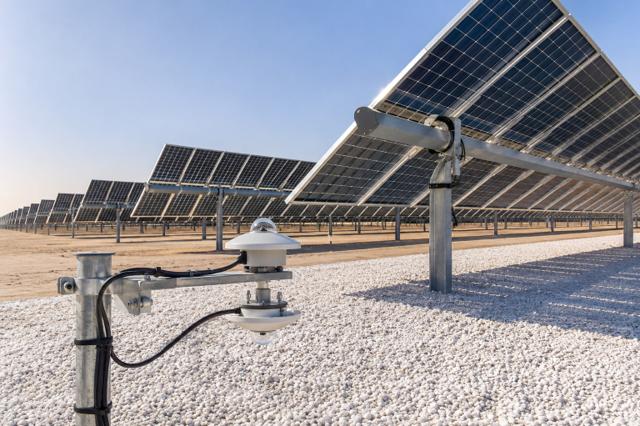
How bifacial modules harvest reflected light, what albedo values to expect on sand, gravel and white membranes, and why bifacial pairs so well with trackers.
LID, LeTID and long-term power loss explained, and how to read a 12-year product / 30-year linear power warranty.
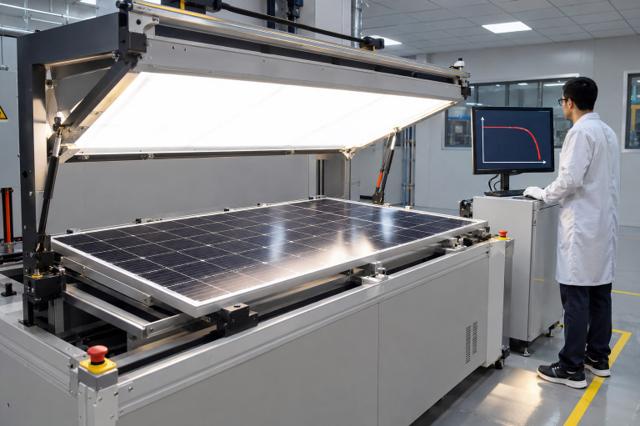
What the datasheet power really means, how temperature coefficients translate into lost watts, and why heat is the main derating factor in the desert.
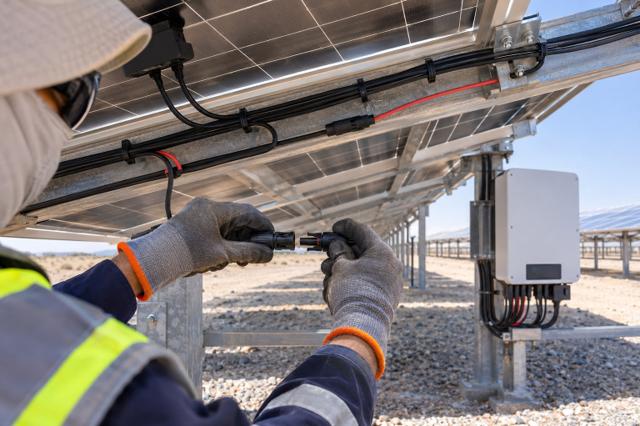
How many modules can go in one string: the cold-temperature Voc limit, the MPPT window and current limits, with a worked 1,500 V example.
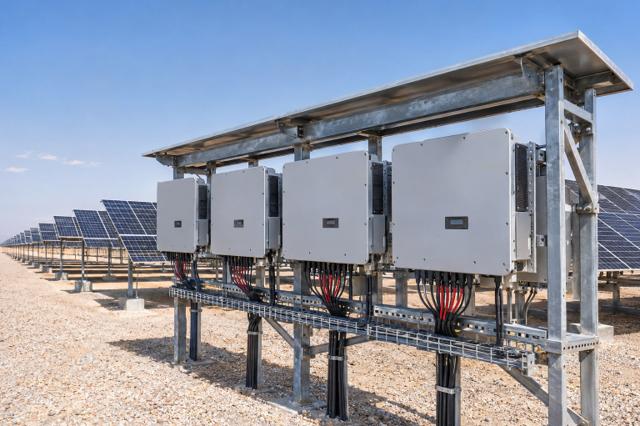
Why PV plants are built with more module power than inverter power, and how to choose a DC/AC ratio between 1.1 and 1.35 without losing too much energy to clipping.
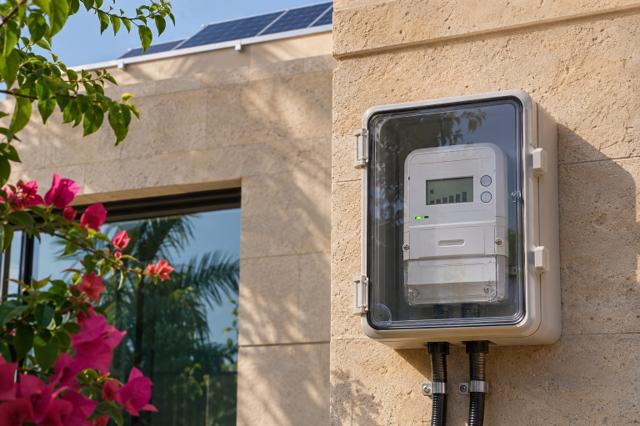
How grid-connected rooftop systems are credited for the electricity they export, and how the tariff scheme changes the right system size and the payback period.

The single number used to compare power plants: lifetime cost divided by lifetime energy, both discounted. What drives it, and why Gulf solar tariffs are among the lowest in the world.
